Now that we have added variability to our process times, arrival, and resource availability, in order to make our process reflect reality, we will simulate the model again and see if we still meet our goal of 40 units/week.
As we did when we ran the previous simulation, we will begin by running a single replication of the simulation.
In the output results, we immediately see that the throughput (Total Exits) has dropped to 195 for the five-week period.
Additionally, if you create a Time Plot of the Assy_WIP variable (Output Viewer Ribbon -> Time Plot -> Time-weighted values and choosing to display Assy_WIP) we see that the WIP is much more variable.
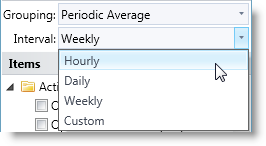
Please Note: By default, the Interval displayed is for "Weekly" time. In order to achieve the same results as the graphic below, please change the interval to "Hourly."
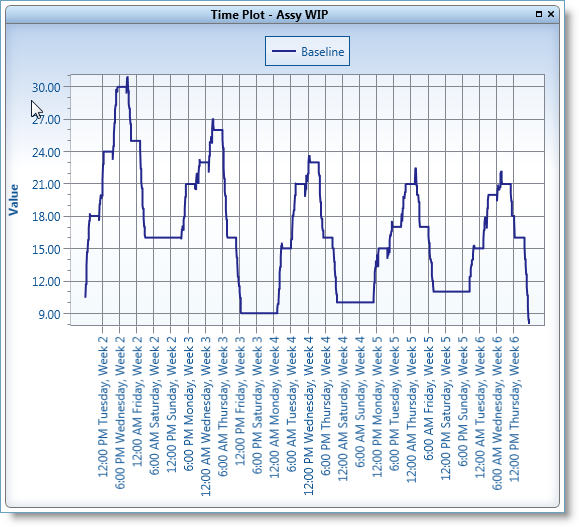
A bottleneck was formed due to variability and resource interdependencies.
Next, we will analyze the averaged effect of variability on the process.
We see in the output the following:
The chart below shows a full comparison of the simulation without variability to the simulation with variability.
| Without Variability | With Variability | Difference | |
| Throughput |
200.40
|
193.05
|
-7.35
|
| Avg WIP |
11.17
|
16.89
|
5.72
|
| Avg Cycle Time |
74.94
|
98.01
|
23.07
|
| Avg Cost |
208.27
|
213.43
|
5.16
|
| Resource Utilization |
|
|
|
| Inspector |
82.62
|
75.55
|
-7.07
|
| Line Op 1 |
63.33
|
62.37
|
-0.96
|
| Line Op 2 |
68.33
|
66.96
|
-1.37
|
| Rework Op |
64.81
|
73.13
|
8.32
|
| Test Unit |
72.46
|
68.59
|
-3.87
|
Please Note: If you are not seeing the same results as described above, you may need to double check your model against the reference tutorial model for this point in the tutorial, Tutorial3.vsd, which is in the same directory as the Tutorial.vsd file.
We will not meet our goal of 40 units/week. If this process had been implemented in the real world, based on the fixed values initially provided, the process never would have met its goal. Changes would have needed to be made post-implementation, which would have been costly in lost time and money.
However, with these results, we may explore changes to the process through simulation, in order to achieve the 40 units/week goal, before the process is actually implemented in the real world.
Please Continue to Step 3: Make Changes to Improve Process