Open topic with navigation
Scoreboard
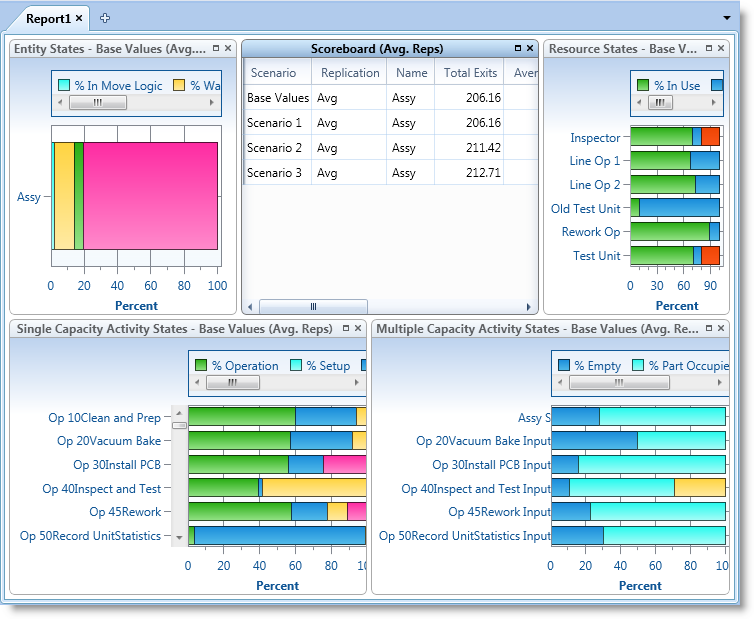
When your simulation ends, and you choose to view the statistics, Output Viewer
launches with a Process Simulator Scoreboard. This scoreboard contains
default views that display the following information:
- Entity State Chart
Shows a stacked bar chart of the entities in the model and
the percentage of time they spent in different states.
- Scoreboard
Provides key statistics for the entities in your model.
- Resource State
Chart Shows a stacked bar chart of the resources
in the model and the percentage of time they spent in different states.
- Activity State
Charts Two charts show stacked bar charts of the
activities (single and multi-capacity) in the model and the percentage
of time they spent in different states.
You are not limited to the reports and charts displayed in the scoreboard,
and may open others while in Output Viewer. Please refer to the Output Viewer Help System
for more information on creating reports and charts.
© 2016 ProModel Corporation • 556 East Technology Avenue • Orem, UT 84097 • Support: 888-776-6633 • www.promodel.com