With all your objects defined and logic entered you are ready to simulate your model to see if we can achieve the goal of 40 units/week.
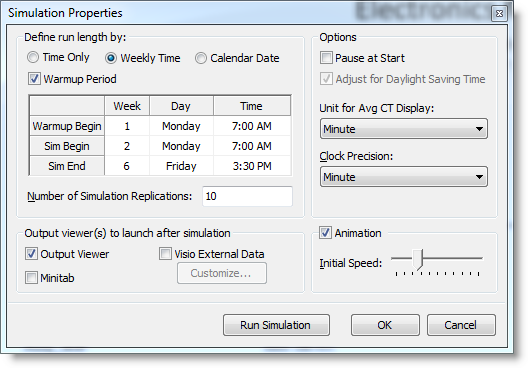
Before we begin the simulation, we need to set up a couple of simulation properties:
Starting your simulation is as easy as clicking the Simulate button from the Process Simulator ribbon.
When the simulation begins the view will change from the Visio layout to the Process Simulator run-time layout. As the simulation runs, you will see the Assy entities move through your process. You will also notice the color of the resources change to reflect their state:
There are several options available in the Run-Time layout, which are described in the Process Simulator Help System.
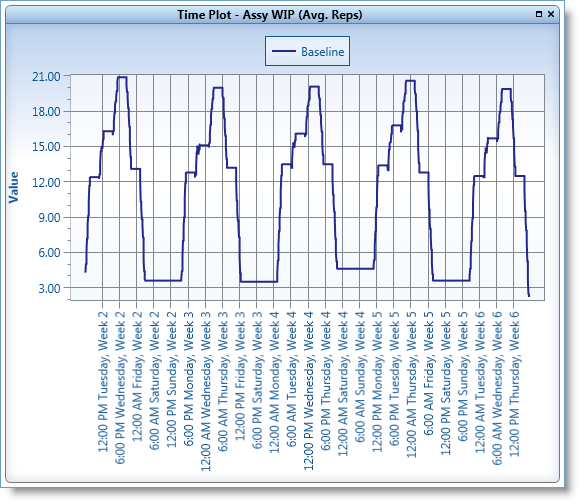
Upon completion of the simulation, you will be prompted to view the output statistics. Choose yes, which will launch the Output Viewer.
From the statistics displayed in the output viewer, you will notice:
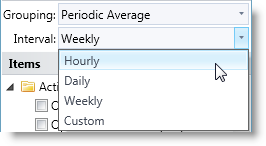
Please Note: By default, the Interval displayed is for "Weekly" time. In order to achieve the same results as the graphic below, please change the interval to "Hourly."
The only variability in our model so far is the 30/70% routing decision for our Test and Inspect activity.
Next, we will average out this variability by running the simulation for 20 replications, and see if our goal of 40 units/week can be met.
Return to Process Simulator, and in the Simulation Properties dialog, change the number of replication from 1 to 20.
Run the simulation again, and view the new statistics.
Notice that Total Exits now equals 200.40, which meets our goal of 40 units/week.
Please Note: If you are not seeing the same results as described above, you may need to double check your model against the reference tutorial model for this point in the tutorial, Tutorial2.vsd, which is in the same directory as the Tutorial.vsd file.
We probably could have calculated throughput of 40 units/week with some simple arithmetic, and most likely did not need to use simulation to come to this conclusion. If our goal was 40 units/week, we could then assume that we have achieved our goals for this process.
However, does this number, which was calculated using constant numbers, really reflect the reality of our process? In the real world, activities do not always process entities at a constant rate. Variability is a critical factor to consider, before we declare that this process will produce 40 Assy units/week.
Therefore, we will add variability, in the form of statistical distributions, to the process times at activities in order to more closely reflect reality. We can then determine if our process will continue to meet the throughput goal of 40 units/week, before we implement the actual process.
Please Continue to Step 2: Add Variability to the Model