Process Simulator links and integrates with Minitab to provide users with Six Sigma analysis capability. This integration allows for the tracking of Six Sigma metrics in a Process Simulator model and the automatic reporting of these metrics in Minitab after a scenario is run.
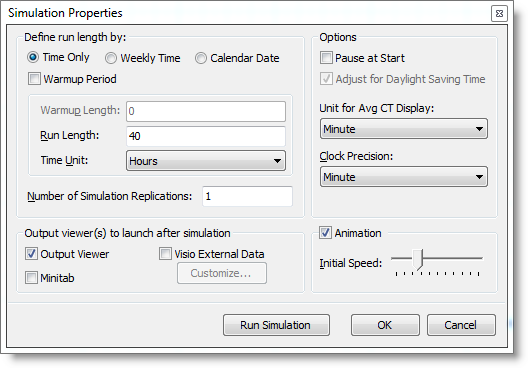
Before simulating a scenario in Process Simulator, adjust the Simulation Properties dialog to include Minitab to automatically launch at the end of the simulation.
Selecting Simulation Properties from either the Process Simulator toolbar or from the Process Simulator drop down menu will open the Simulation Properties dialog.
By default the Output Viewer check box is selected under “Output viewer(s) to launch after simulation” in the Options section of the dialog.
Select the Minitab check box to automatically launch Minitab at the end of the simulation. When prompted to view the statistics after the simulation runs, if a Six Sigma configuration has been defined in the Six Sigma Configuration dialog, the results will be summarized and displayed in Minitab.
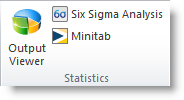
A Minitab icon has been added to the Process Simulator ribbon. Click on it to launch Minitab.
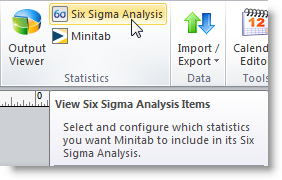
A Six Sigma Analysis icon has been added to Process Simulator ribbon. Click on it to launch the Six Sigma Configuration dialog.
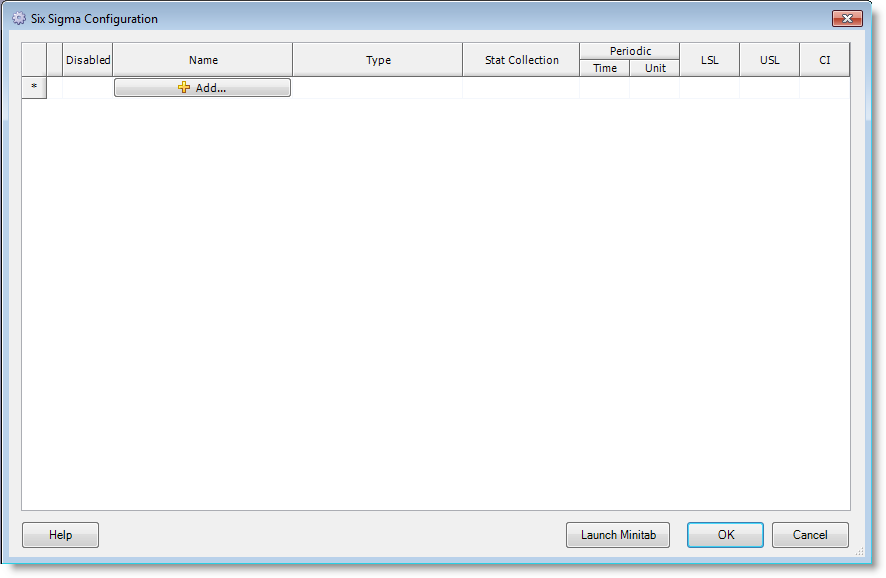
The Six Sigma Configuration dialog appears once you’ve selected Configure from the Process Simulator > Six Sigma Analysis menu.
Disabled Click and place a checkmark in the box in the Disabled column for items to be temporarily removed from the analysis. This does not delete the items but rather disables them from being included in the Six Sigma analysis while preserving all the information about the item.
Name Name of the analysis item selected in the Add Analysis Item dialog. This name can be modified by double-clicking in the cell. This name will be used in the title of the graph generated in Minitab.
Type Type of analysis item selected in the Add Analysis Item dialog.
Stat Collection Choose a method of statistical summarization for Six Sigma Analysis of a particular item.
Periodic Time Applies only when Periodic Average is selected for the Stat Collection. It represents a range of time that all values logged within that range will be averaged. The total number of periods depends upon the length of the simulation. For example, if a simulation runs for 8 hours and a period is defined as 2 hours, then a total of 4 periods will be the result.
Periodic Unit Applies only when Periodic Average is selected for the Stat Collection. It is the unit of time, be it seconds, minutes, hours, days, months or years, for the value specified for Periodic Time.
LSL (Lower Spec Limit) – A user-defined limit that can be specified on its own or with an Upper Spec Limit. However, both the LSL and USL cannot remain blank.
USL (Upper Spec Limit) – A user-defined limit that can be specified on its own or with a Lower Spec Limit selected. However, both the USL and LSL cannot remain blank.
CI (Confidence Interval) – This value is used in generating the Capability Analysis graph in Minitab. By default, a confidence interval of 95 is automatically entered when a new Analysis Item is added to the Six Sigma Configuration table but can be modified if desired.
Launch Minitab Button – Clicking on this button will launch Minitab. If a simulation has already been run and the statistical data has been generated, the analysis items in the Six Sigma Configuration table will be summarized and graphed in Minitab.
OK – Click the OK button to close the Six Sigma Configuration dialog and save any changes that were made.
Cancel – Click the Cancel button to close the Six Sigma Configuration dialog and discard any changes that were made.
![]()
Add Button Click on the Add button in the Six Sigma Configuration table to select items to be included in a Six Sigma analysis. The Add Analysis Item dialog opens.
Add Click the Add button (or double-click) to add an item to the Six Sigma Configuration table. Analysis items are appended to the table in the order they were selected to be added.
Done Selecting the Done button will close the Add Analysis Item dialog.
Two charts are generated in Minitab per scenario for each Six Sigma analysis item defined in Process Simulator - the Capability Analysis Chart and the Capability Sixpack Chart.
Please Note: Process Simulator assumes that the data generated is normal and creates the charts in Minitab accordingly. It is up to the person validating the results to determine the normality of the data.
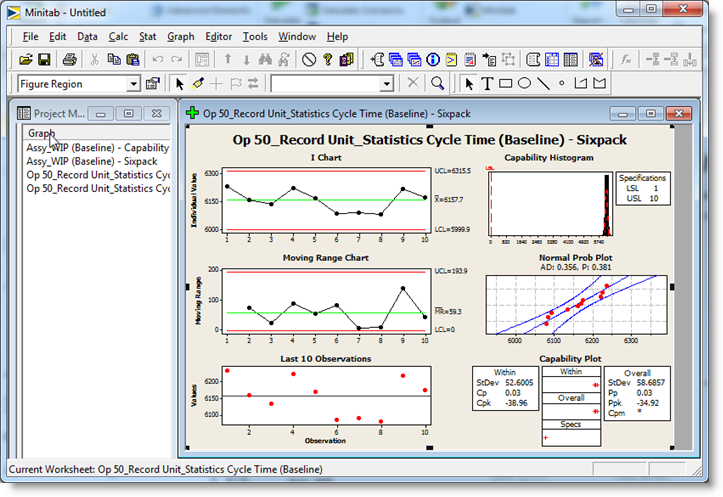
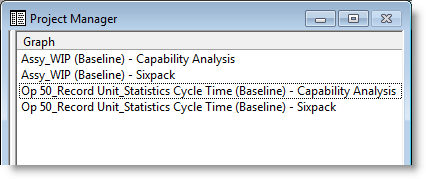
Toggle between the Minitab charts by double-clicking on them in the Project Manager panel, located by default, on the left in Minitab.
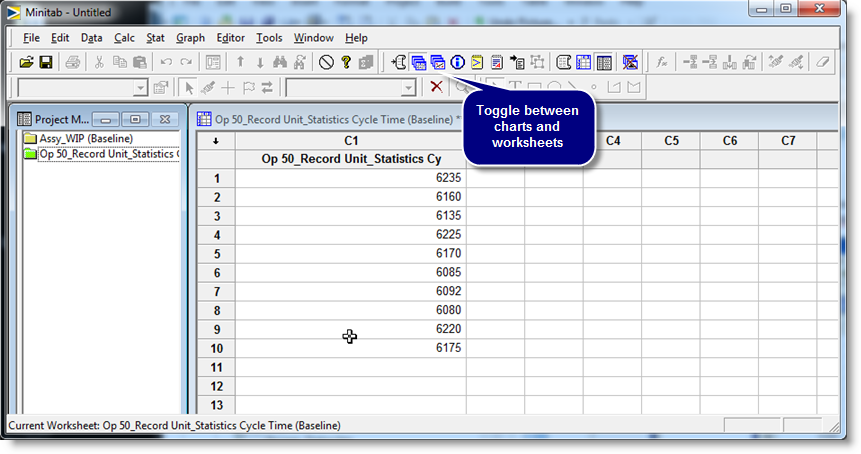
To view the data generated by Process Simulator and populated in Minitab, select the Worksheets Folder view from the Minitab toolbar.
© 2011 ProModel Corporation • 556 East Technology Avenue • Orem, UT 84097 • Support: 888-776-6633 • www.promodel.com