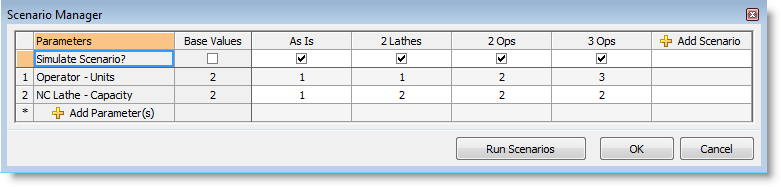
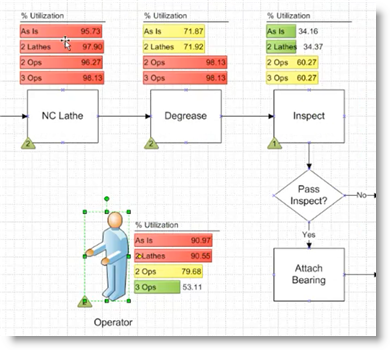
This section will discuss utilizing Data Graphics when running multiple scenarios. In order to take advantage of Data Graphics and multiple scenario analysis, Process Simulator Data Graphics with the keyword ‘(Scenarios)’ in the name must be used. Or, if custom data graphics have been created, the data graphic must use a Process Simulator data item containing a scenarios property.
© 2011 ProModel Corporation • 556 East Technology Avenue • Orem, UT 84097 • Support: 888-776-6633 • www.promodel.com