The Debugger is a convenient and efficient way to test or follow the processing of any logic defined in your model. The debugger is used to step through logic one statement at a time and examine variables and attributes while a model is running.
Before discussing the details of the Debug option, it is important to understand the following terms:
Please note: Even though several threads can execute the same logic at the same time in the simulation, the simulation processor can only process them one at a time. So there is really only one current thread while all other threads are suspended (either scheduled for some future simulation time, or waiting to be executed at the same simulation time).
The Debugger dialog is only available at run time, and can be opened during the simulation by clicking on the Debug option in the toolbar. It will also open automatically if the simulation logic encounters a DEBUG statement. The Debugger can be used in two modes: Basic and Advanced. The Basic Debugger appears initially with the option of using the Advanced Debugger.
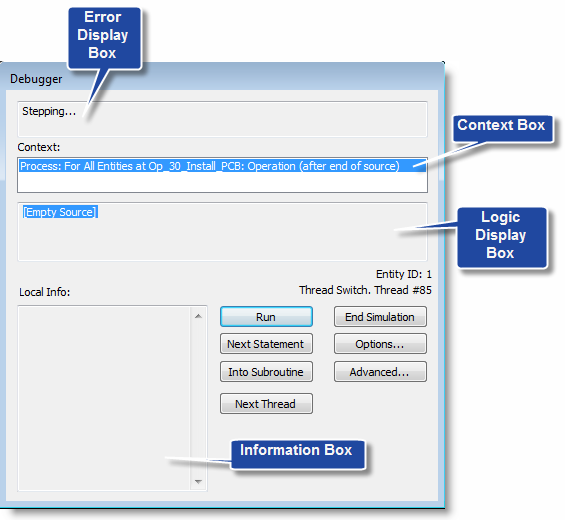
Error Display Box Displays the error message or reason why the Debugger dialog box is displayed, such as the User-Condition becoming true.
Logic Display Box Displays the statements of the current logic being executed.
Context Box Displays the module, operation, and line number (in which the debugger stopped) in the Information box.
Information Box Displays local variables and entity attributes with non-zero values.
Run Continues to run the simulation, but still checks the debugger options selected in the Debugger Options dialog box.
Next Statement Jumps to the next statement in the current thread. If the last statement executed suspends the thread, another thread meeting the debugger conditions may be displayed as the next statement.
Into Subroutine Steps to the first statement in the next subroutine executed by this thread. Again, if the last statement executed suspends the thread, another thread meeting debugger conditions may be displayed first. If no subroutine is found in the current thread, a message is displayed in the Error Display box.
Next Thread Jumps to the next initiated or resumed thread. This button has the same functionality as the Next Thread button in the Basic debugger.
End Simulation Choose this option to terminate the simulation. This will prompt you about collecting statistics.
Options Brings up the Debugger Options dialog box. You may also bring up this dialog box from the Simulation menu.
Changes the Debugger to Advanced mode, provides additional options discussed next.
Next (Thread) Jumps to the next initiated or resumed thread. This button has the same functionality as the Next Thread button in the Basic debugger.
New (Thread) Jumps to the next initiated thread.
Disable (Thread) Temporarily disables the debugger for the current thread.
Exclusive (Thread) The debugger displays the statements executed within the current thread only. When the thread terminates, the exclusive setting is removed.
Next (Logic) Jumps to the next initiated or resumed thread that is not executing the same logic as the current thread.
New (Logic) Jumps over any resumed threads to the next initiated thread not executing the same logic as the current thread.
Disable (Logic) Temporarily disables the debugger for all threads executing the current logic (see also enable).
Exclusive (Logic) The debugger displays only the statements executed in any thread executing the current logic.
Enable disabled threads and logics Enables the threads and logics which were disabled previously.
The Debugger Options dialog allows the user to specify when to display the Debugger dialog box during the simulation run.
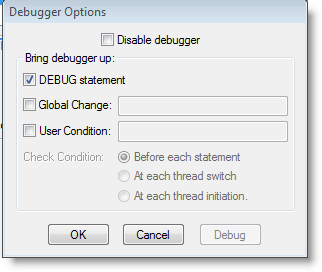
Disable debugger Disables the debugger completely. By default the debugger is enabled. Running the model with the debugger disabled increases the run speed. When running multiple replications or scenarios, or when the animation is disabled, the debugger will automatically be disabled.
DEBUG statement Displays the Debugger dialog every time a DEBUG statement is encountered in an enabled process while running the simulation.
Global Change Displays the Debugger dialog every time a global change occurs to a specified variable or array. The Debugger dialog shows the original and new value of the element. Only one global name can be specified in this box.
User Condition Displays the Debugger dialog when a defined user condition written as a Boolean expression becomes true, for example, when Var1=5. Only one expression can be specified in this box, although several conditions can be tested by using the OR operator.
Check Condition Allows the user to define how often to check the user condition. The options include:
Debug button Pressing the Debug button displays the Debugger dialog before the next statement executes.
OK Closes the Debugger Options dialog and continues to run the simulation model.
© 2011 ProModel Corporation • 556 East Technology Avenue • Orem, UT 84097 • Support: 888-776-6633 • www.promodel.com