Click on the Tables drop-down and select Logs in the Other group.
A table is generated, which lists summarized statistics of all log entries as defined by the user, and contains the following columns of information.
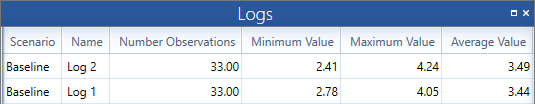
Scenario: The scenario to which the row applies.
Name: The name of the log.
Number of Observations: The number of log entries that occurred during the simulation for the given Log.
Minimum Value: The minimum log entry value during the simulation for the given Log.
Maximum Value: The maximum log entry value during the simulation for the given Log.
Average Value: The average value of all log entries during the simulation for the given Log.
Note: Log statistics are set up by the user with a LOG statement to track the time entities spend between any two points in the model.