A trace is a list of events occurring over the course of a simulation. For example, a trace statement might state
A trace listing is generated in one of three modes, Step, Continuous, or Filtered.
Select this option to discontinue a current trace.
Select this option to step through the trace listing one event at a time. Each time you click the left mouse button, the trace will advance one event. Clicking and holding the right mouse button while in this mode generates a continuous trace.
Select this option to write the trace continuously to the output device selected from the Trace Output submenu. This is useful when you do not know exactly where to begin or end the trace. Clicking and holding the right mouse button stops the trace until you release the button.
When you view the Trace during simulation, you see a list of all the events that occur as your model is running.
Although it may be helpful to view every event in the simulation, there are many times when you will want to focus on just the events that affect specific elements (locations, resources, variables, etc.) of your model.
The Trace feature contains an optional, custom filter, which allows you to pick the elements of your model, or custom text string, that you wish to view in the Trace window.
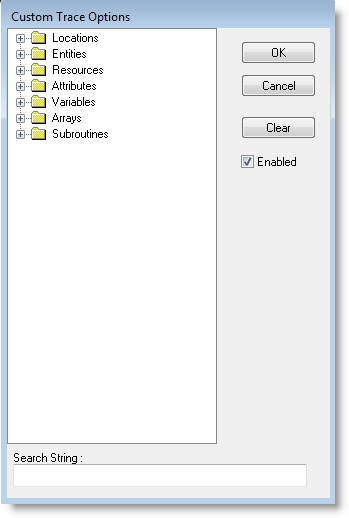
From the Custom Trace Options dialog, you may choose which elements of your model you want displayed in the Trace window.
The Custom Filter works by showing the specified elements in the trace according to the following:
The Enable button in the Custom Trace Options dialog must be checked for the Trace Filter to take effect.
Select this option to send the trace listing to a text file. Trace statements are automatically written to a <model name>.TRC file.

|
© 2012 ProModel Corporation • 556 East Technology Avenue • Orem, UT 84097 • Support: 888-776-6633 • www.promodel.com |